 Charts
Advanced Reports provides a powerful way to visualize your Jira data through charts.
Both Local Reports and Local Insights editors allow you to create charts based on the SQL query results. Charts are rendered using Vega-Lite (opens in a new tab) and Vega (opens in a new tab) under the hood — both specification formats are supported.
Charts can also be interactive — supporting tooltips, hover highlighting, selections, zooming and panning — and can be generated for you by AI: by the AI Explorer (Advanced Edition) or by the AI Assistant when editing Insights.

Edit chart in the report
Charts in Insights editor
You can create charts in the Insights editor by clicking on the "Charts" button in Results section. From here you can access charts for the current query or create a new chart.

Manage charts in Insights editor
Charts in Report editor
Insert chart by selecting "Query Chart" from the toolbar.

Insert chart in the report
The "Select data source for the chart" modal will appear, allowing you to select an existing chart or create a new one.
Insert chart in the report
AI-generated charts
You don't have to build charts by hand — AI can generate them for you:
- AI Explorer (Advanced Edition) — ask natural language questions about your Jira data and get answers complete with charts, without writing any SQL or chart specifications.
- AI Assistant — when editing Insights, ask the assistant to create or modify a chart for your query results. It can produce both Vega-Lite and Vega specifications, including interactive features.
AI-generated charts can be further tweaked in the chart editor, just like charts created manually.
Editing charts
Type specific vs advanced editors
Chart editor presents different options depending on the chart type. Available chart types include:
- Bar Chart
- Line Chart
- Area Chart
- Scatter Chart
Any of the chart type specific editors can be "upgraded" to "Advanced" editor which:
- shows more options
- allows you to create multiple layers and mix and match different chart types (e.g. area, bar and line charts)
- allows you to edit the chart JSON directly
To upgrade, click on the "Advanced" button in the chart editor dialog.

Insert chart in the report
Visual editor does not support all the features of Vega-Lite, but you can edit the chart JSON directly. To do this, click on the JSON toggle in the chart editor dialog.
You can edit JSON directly following the Vega-Lite Top-Level Specification (opens in a new tab), or provide a full Vega specification (opens in a new tab) for maximum control over the visualization.
Vega-Lite vs Vega
- Vega-Lite is a concise, high-level format — ideal for most charts and the format used by the visual editors.
- Vega is a lower-level, more verbose format that unlocks advanced visualizations and fine-grained control over scales, signals, and interactions not expressible in Vega-Lite.
The JSON editor accepts both formats — the chart renderer detects which specification you are using automatically.
Interactive charts
Charts are not limited to static images — specifications can include interactive behaviour such as:
- Tooltips showing details on hover
- Hover highlighting of marks
- Selections for filtering or emphasising data points
- Zooming and panning of the chart area
In Vega-Lite, interactivity is added via parameters and selections (opens in a new tab); in Vega, via signals and event streams (opens in a new tab).

Insert chart in the report
Examples of charts
Bar Chart

Bar Chart
Line Chart

Line Chart
Area Chart
Area Chart
Scatter Chart

Scatter Chart
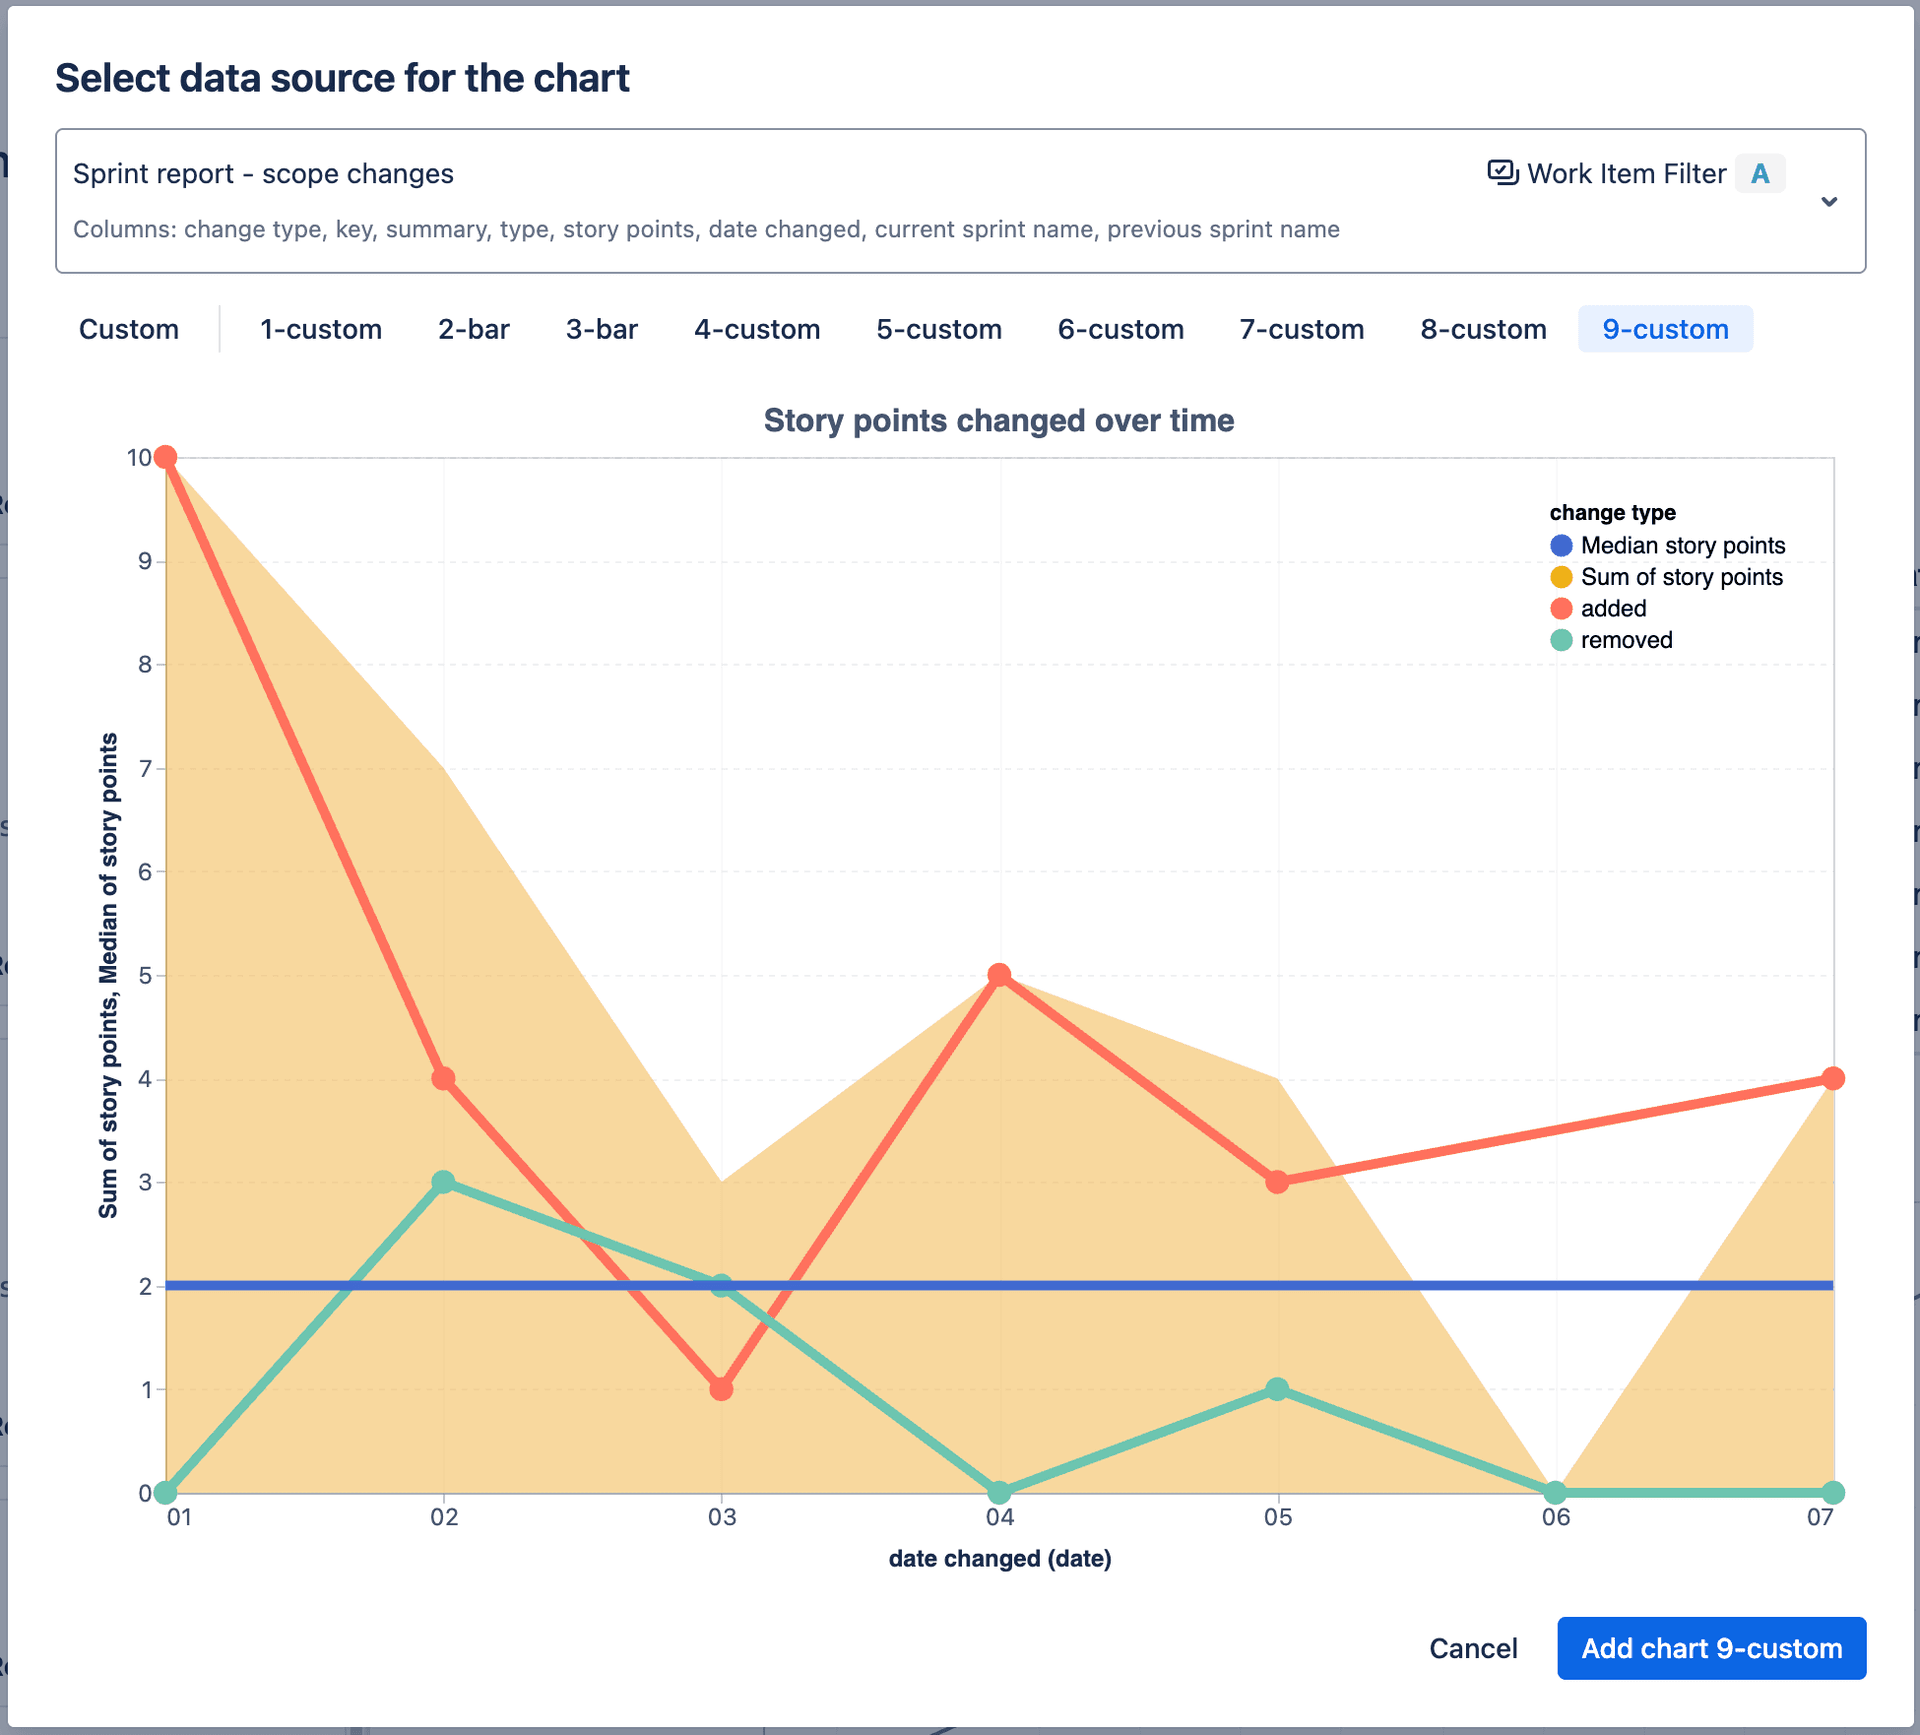
Advanced chart with multiple layers
The chart below consists of 3 layers:
- line chart showing 2 lines
- area chart showing totals of the two lines
- reference line showing the median value for all the values

Advanced chart with multiple layers