 Local Reports
Reports provide a flexible canvas to combine narrative text, images, and dynamic data visualizations derived from your Jira information. The report editor functions similarly to Confluence, allowing you to freely type text, apply formatting (like bold, italics, lists), and insert images.
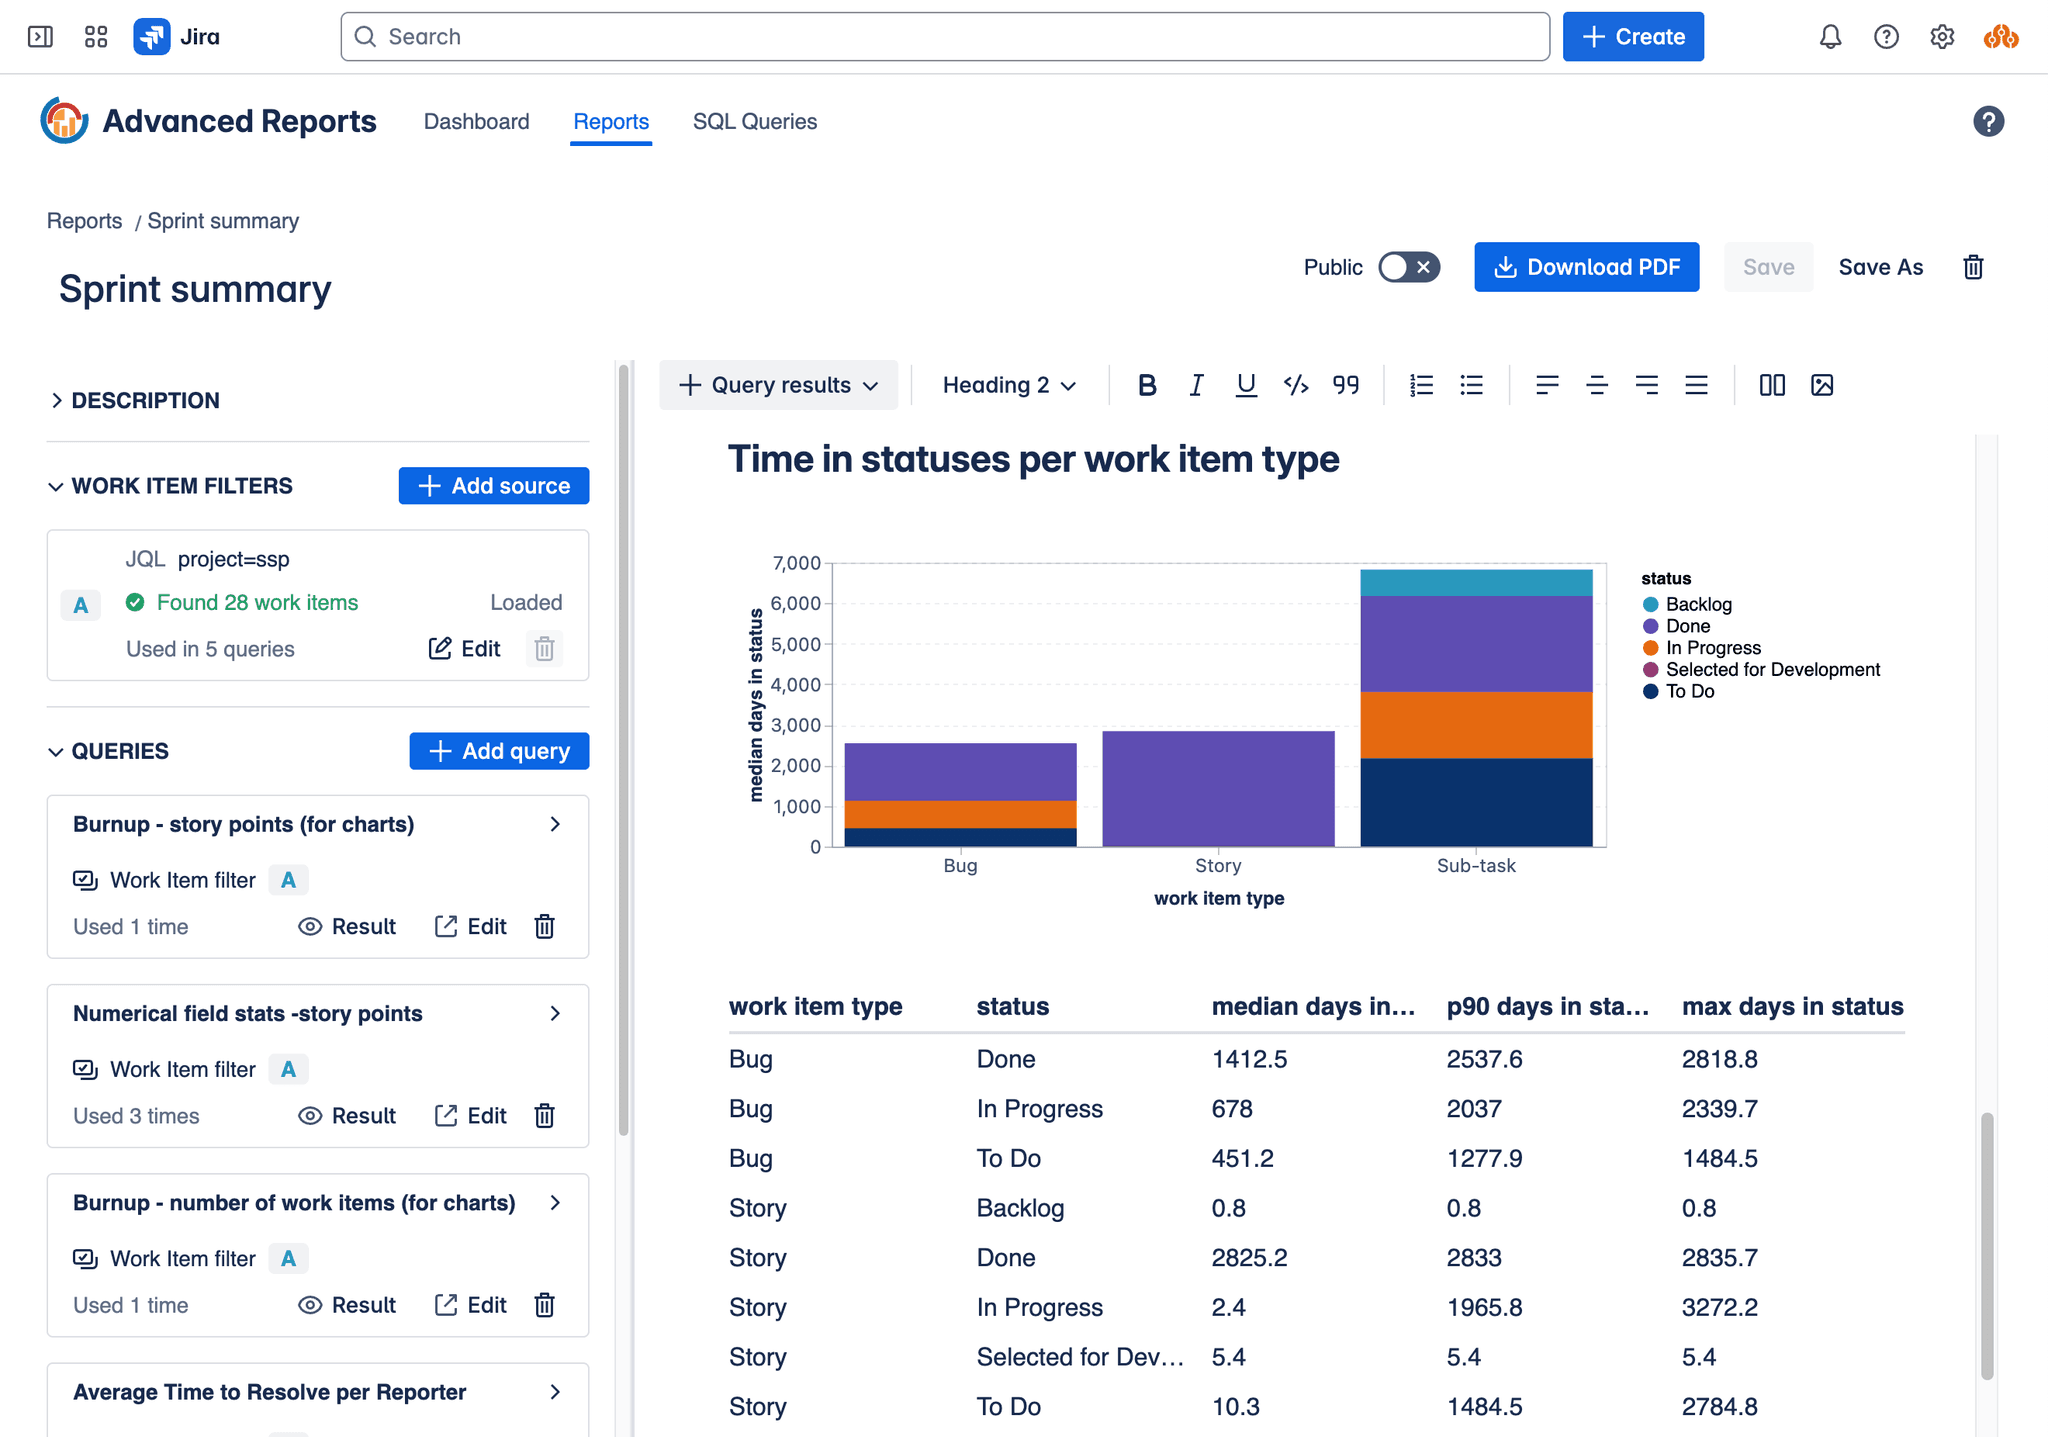
Report Editor screen
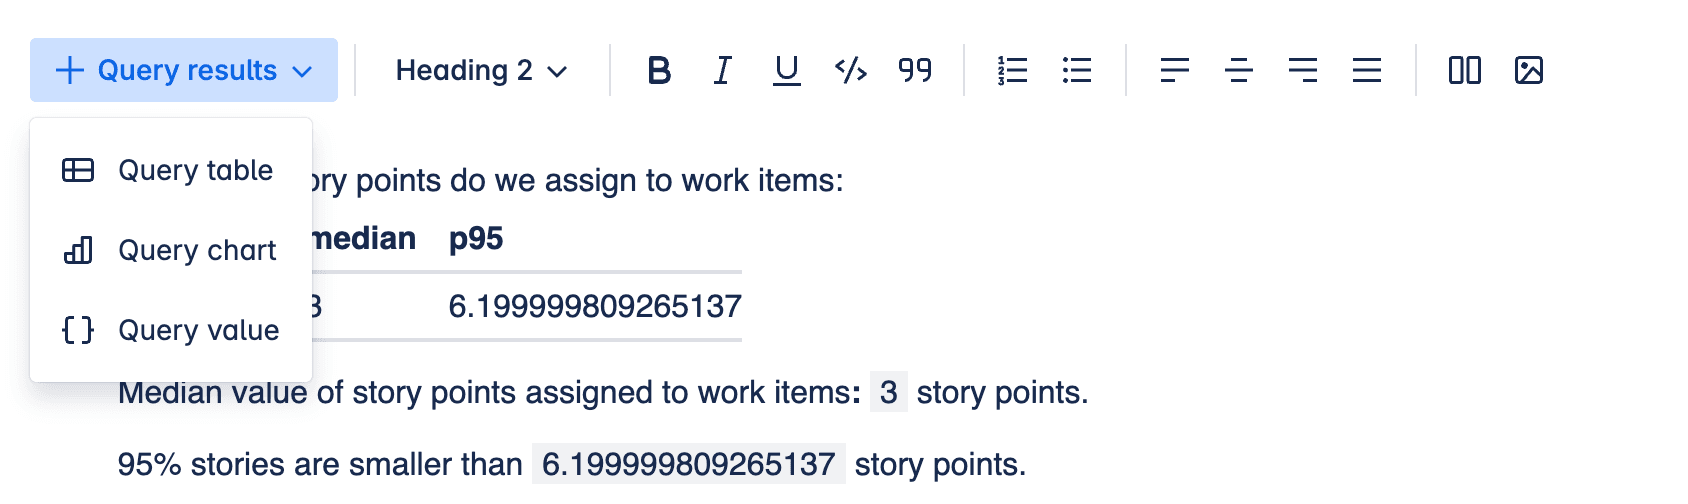
The core power of reports lies in their ability to embed live data generated by Local Insights. You can insert data visualizations directly into your report content:
- Tables: Display raw query results in a structured tabular format.
- Charts: Visualize query results using various chart types (e.g., bar, line, pie) for easier trend analysis and comparison.
- Single Values: Extract specific aggregate metrics from your query results, such as averages, percentiles (P50, P85, etc.), minimums, maximums, or sums.
To incorporate dynamic data, you first select the Local Insights you want to use within the report. For each query instance you add, you must specify:
- Work Item Filter: The set of Jira work items the query should run against (defined by JQL, a saved filter, board, or sprint).
- Parameters (if applicable): If the chosen Insight uses parameters (like
$status_categoryor$work_item_type), you provide the specific values for those parameters for this particular instance in the report.
This setup allows for great flexibility. You can reuse the same underlying Insight (and its SQL query) multiple times within a single report, each time configured with different Work Item Filters or parameter values. For example, you could display several "Cycle Time" charts in one report: one showing cycle time for 'Bugs', another for 'Tasks', and perhaps another comparing cycle times across different sprints, all powered by the same parameterized cycle time SQL query.
Editing a report
To edit a report:
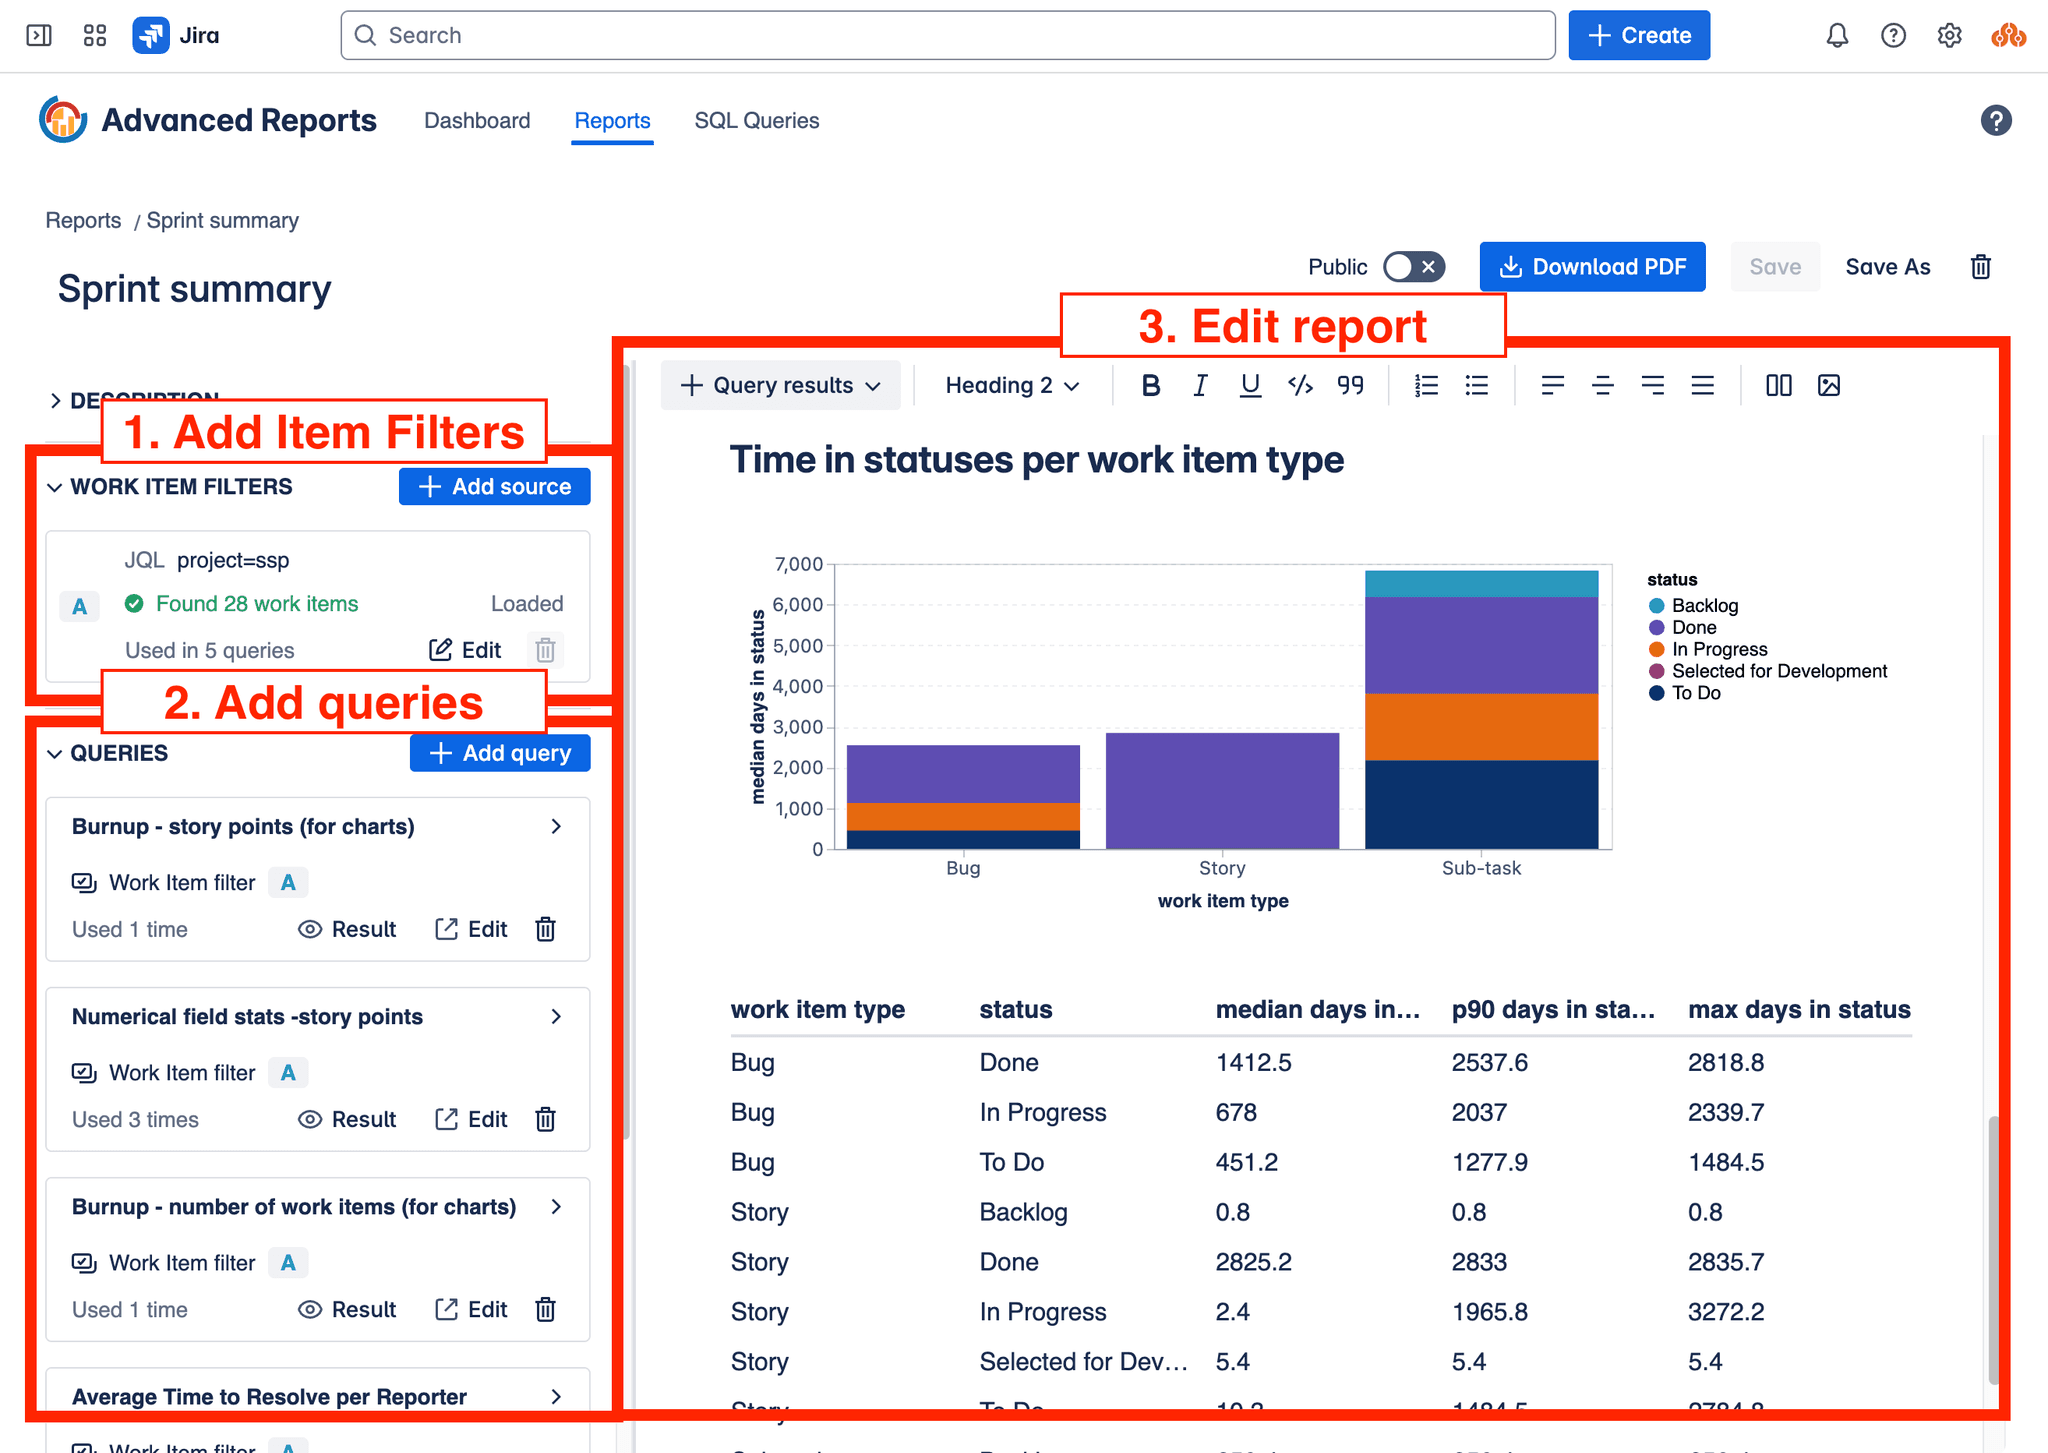
Report Editor - the process
- Define Work Item Filters: Use the filter management section to define the sets of Jira work items (using JQL, saved filters, boards, or sprints) that your report's queries will operate on. You can define multiple filters if needed.
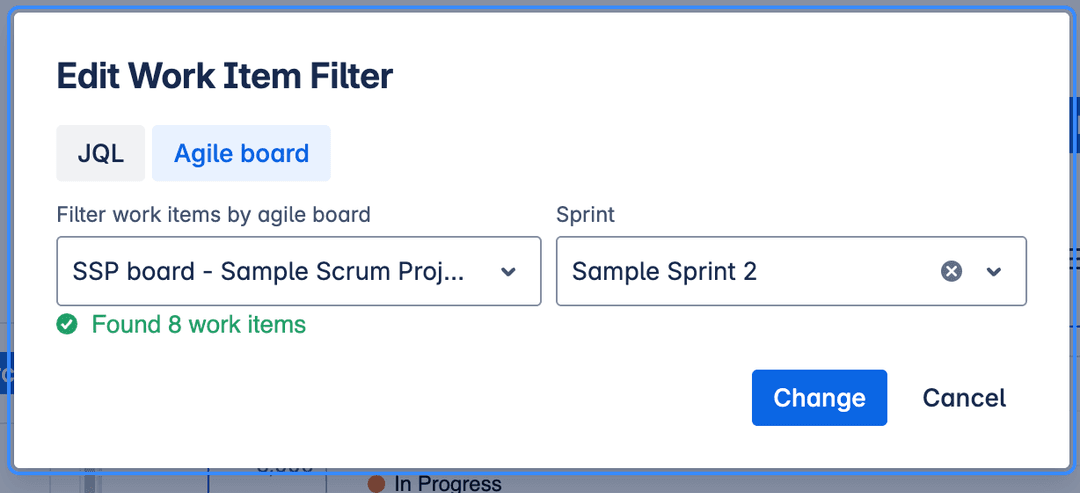
Edit Work Items Filter
-
Select Insights: Choose the pre-defined Local Insights you want to incorporate into your report. For each Insight you add, associate it with one of the Work Item Filters you defined and provide any necessary parameter values.

Add Insight
-
Compose Content and Insert Visualizations: Use the main editor canvas to write narrative text, add images, and apply formatting. Insert dynamic data visualizations (tables, charts, single values) by selecting the configured Insights instances you added in the previous step. Arrange these elements to build your comprehensive report.
Editing report content
The report editor allows you to freely type text, apply formatting (like bold, italics, lists), and insert images. You can also add dynamic data visualizations (tables, charts, single values) by selecting the configured Insights instances you added in the previous step.
Report editing toolbox
Dynamic elements
These are report elements that are generated from Insights. They can be tables, charts, or single values.
Charts
Uses Vega-Lite (opens in a new tab) under the hood. Examples of Vega-Lite charts (opens in a new tab)
Visual editor does not support all the features of vega-lite, but you can edit the chart JSON directly. To do this, click on the chart and select "Edit Chart" from the toolbar. Use can edit JSON directly following Top-Level Specification specification (opens in a new tab)
See Charts for more information on how to create and manage charts based on Insights results.
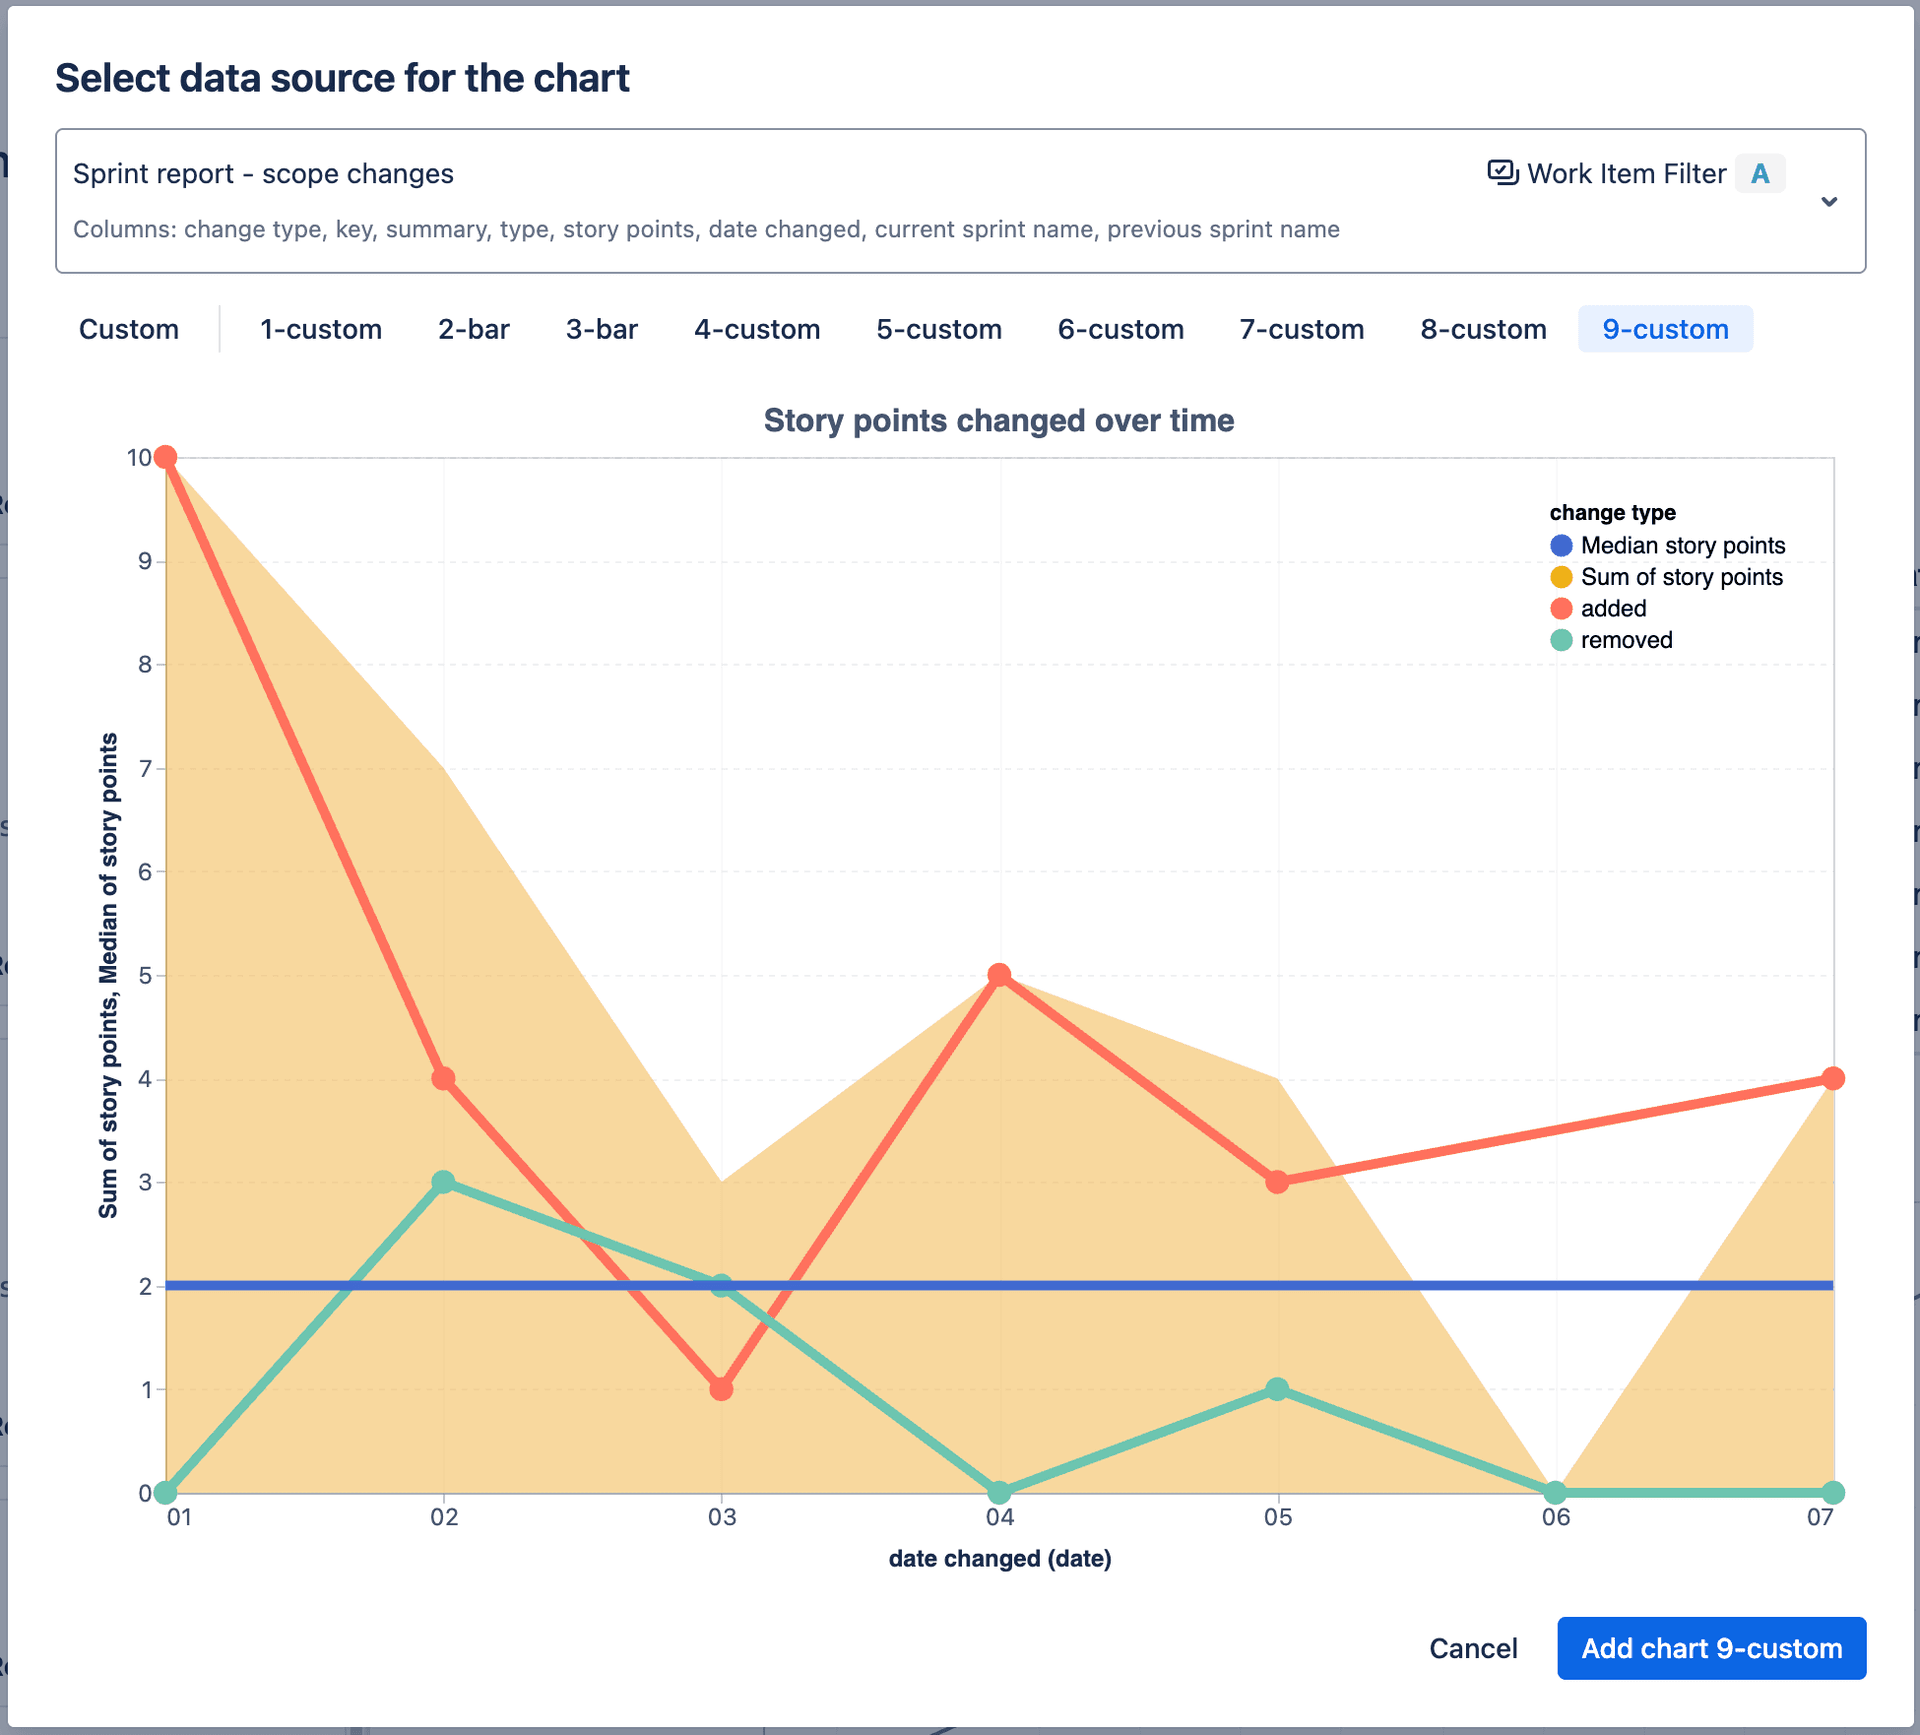
Edit chart in the report
Tables
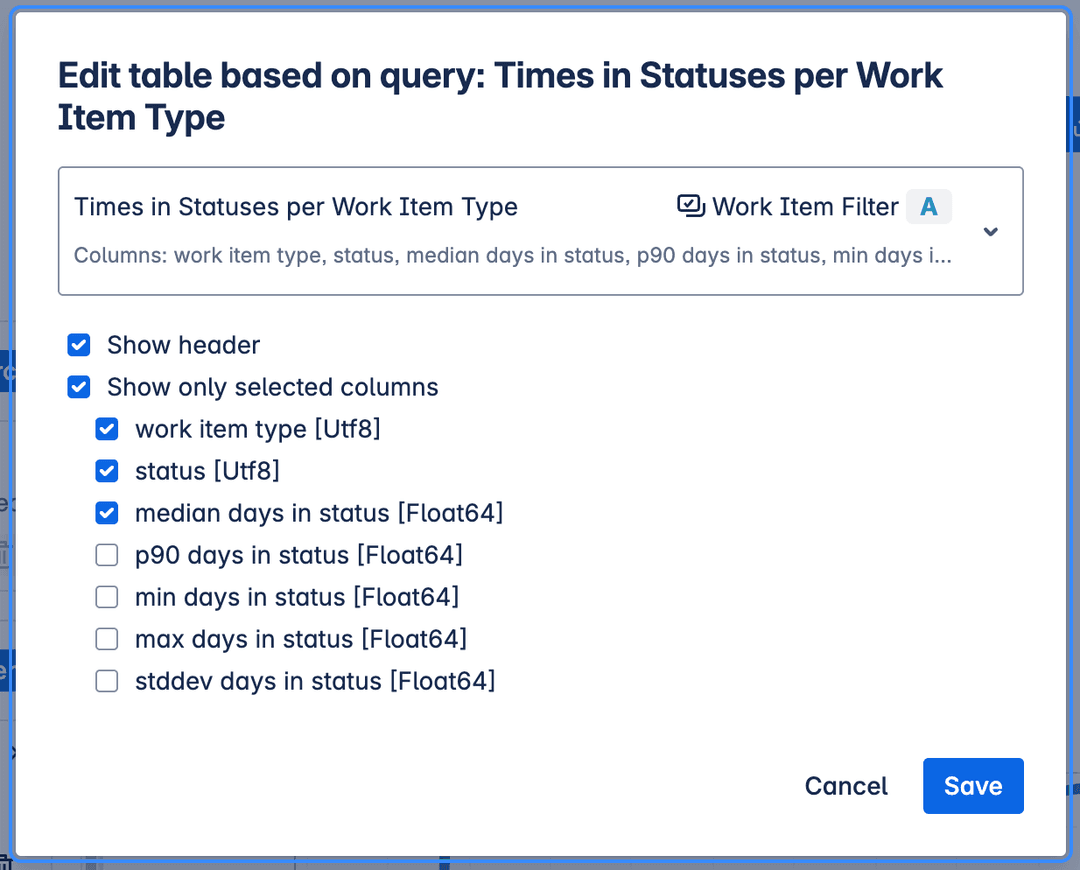
Edit table in the report
Values
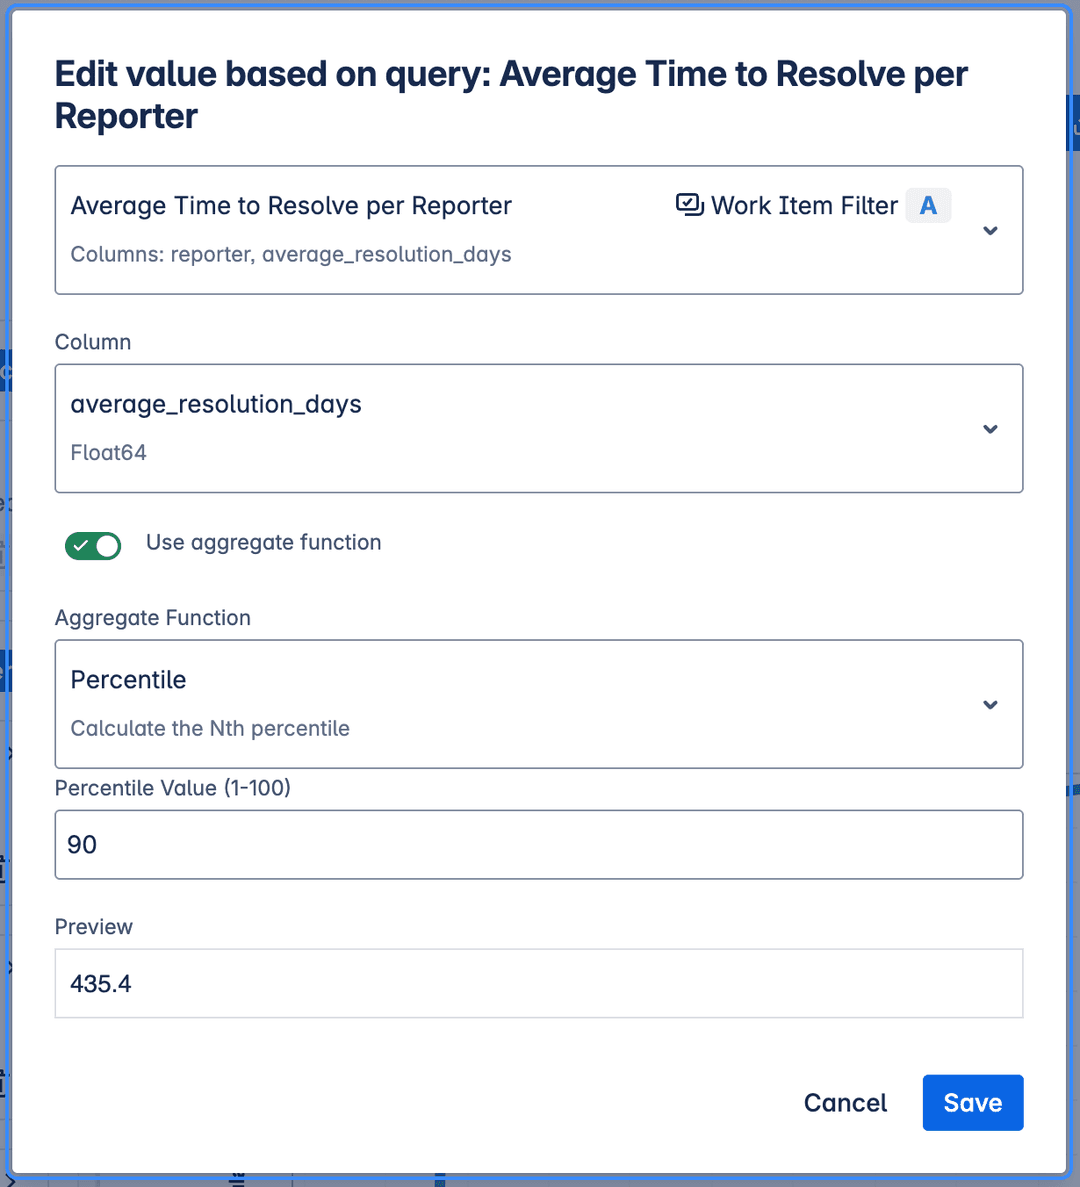
Edit chart in the report
You can display single value from the Insight results. This is useful for showing aggregate metrics like averages, percentiles (P50, P85, etc.), minimums, maximums, or sums. You can display value as is or use aggregate function on selected column.
Editing dynamic report elements
Every item in the report can be edited. When selected, a toolbar appears which contains information about the Insight and Work Items Filter used, as well as options to edit, which depends on what is selected (chart, table or single value).
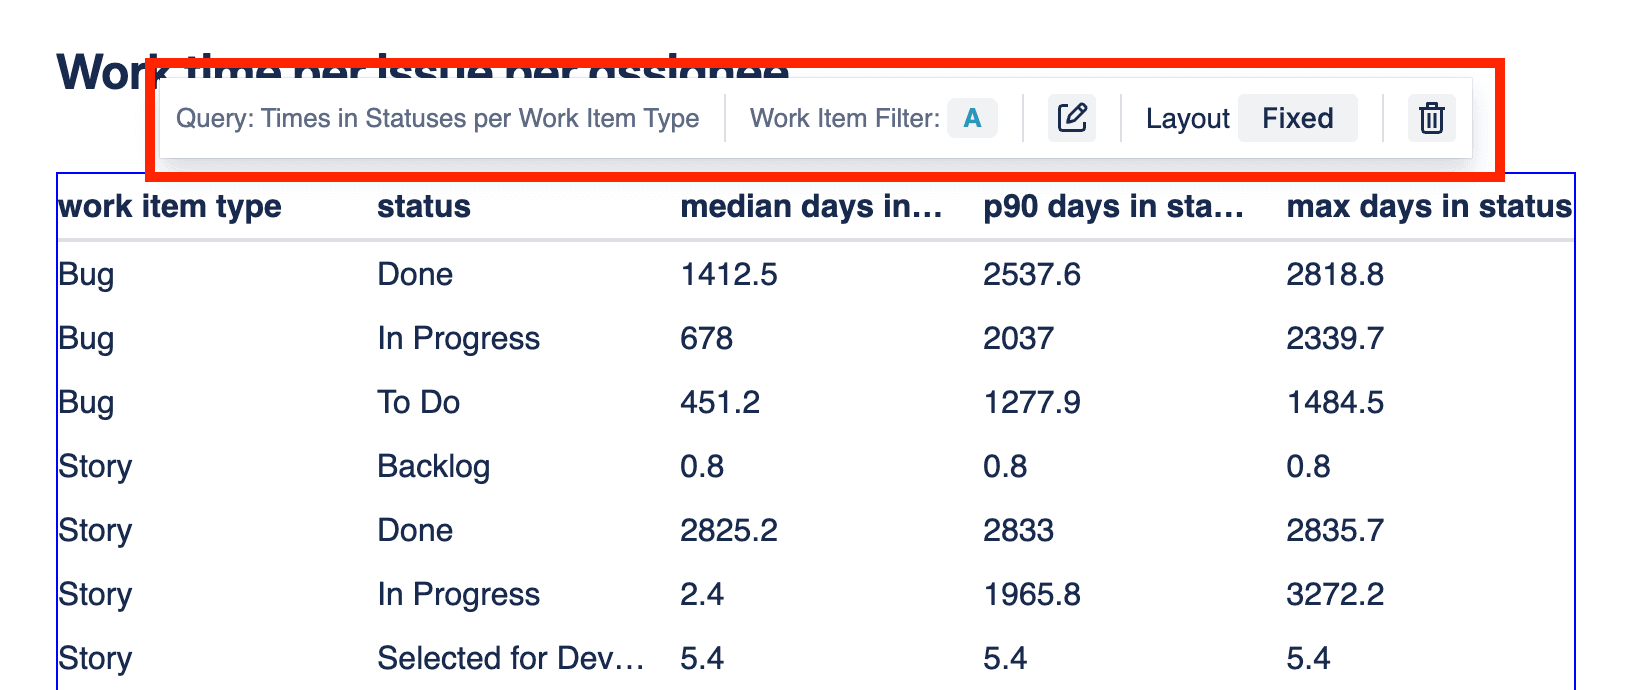
Report table toolbar
Settings
Settings allow you to configure the report's appearance. You can access the settings at the bottom of the the left panel.
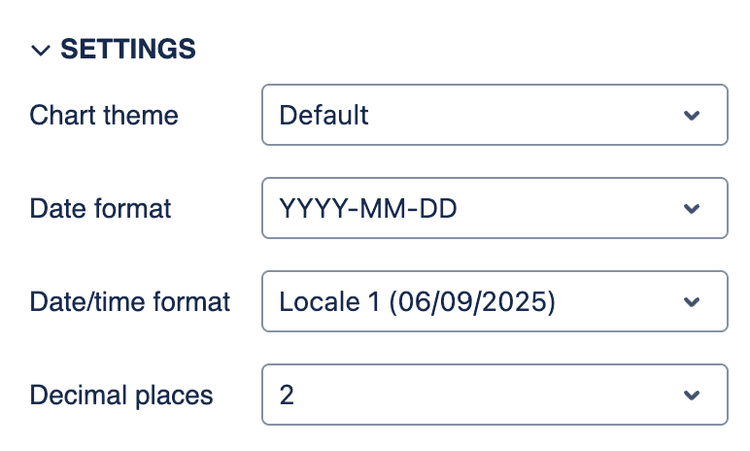
Report settings
Options:
- Date format - Choose the format for displaying dates in the report. All the dates in the report will be displayed in this format.
- Date/time format - Choose the format for displaying date and time in the report. All the dates in the report will be displayed in this format.
- Decimal places - Set the number of decimal places to display for numeric values in the report. This applies to all numeric values, including those in tables and charts.
How report generation actually works?
When you view or refresh a report, the system performs the following steps to generate the dynamic content:
- Identify Data Needs: The system first scans the report to find all embedded data visualizations (tables, charts, single values) and their associated Local Insights and Work Item Filters.
- Gather Required Fields: It determines the complete set of Jira fields needed by all the SQL queries from Insights used in the report.
- Fetch Jira Data: The necessary work item data is fetched from Jira. To optimize performance, the system combines the required fields and fetches data for all unique Work Item Filters used in the report in as few API calls as possible.
- Prepare Data Environment: For Local Insights, once the data is retrieved from Jira, it's loaded into a temporary in-memory database. Cloud Insights utilize the server-side database directly. A schema reflecting the structure of the fetched Jira fields is prepared.
- Execute Queries Sequentially: The system then processes each data visualization instance one by one.
- Filter for Context: Before running the SQL query for a specific visualization, a temporary
work_itemstable (or view) is created within the database. This table contains only the Jira work items that match the specific Work Item Filter and parameters defined for that particular visualization instance. - Run SQL: The associated SQL query is executed against this filtered
work_itemstable.
- Filter for Context: Before running the SQL query for a specific visualization, a temporary
- Render the Report: After all queries have been successfully executed and their results collected, the final report document is rendered, displaying the narrative text alongside the generated tables, charts, and single values.
This process ensures that each visualization displays data relevant to its specific configuration while optimizing the data fetching from Jira.
To help you get started quickly, the application also provides a library of pre-defined report templates, which come bundled with relevant SQL queries and visualizations.